See the details of every Exception thrown when debugging in Visual Studio
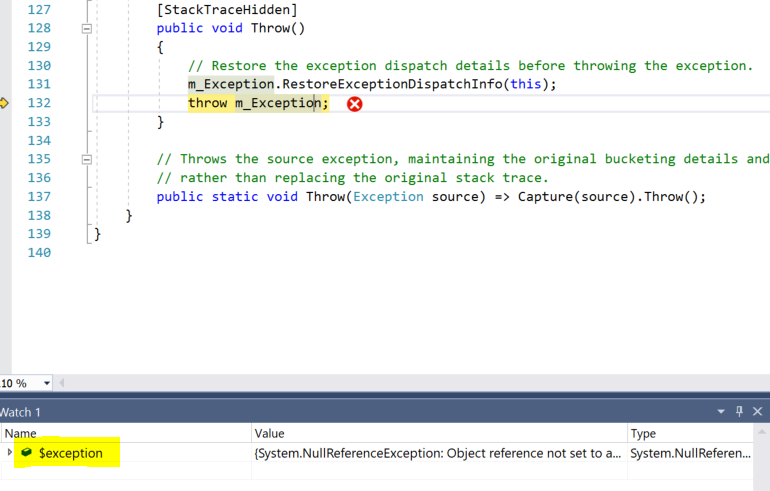
When debugging your .NET application with Visual Studio, you will come along Framework- or Application-Exceptions. In specific cases you see the line where the Exception was thrown (line 132 in the following screenshot) but you cannot see the content (message, stacktrace, etc.) of the Exception. To find this information simple type the following in the watch list area of Visual Studio:
$exception
You can now see all the needed details of the Exception: